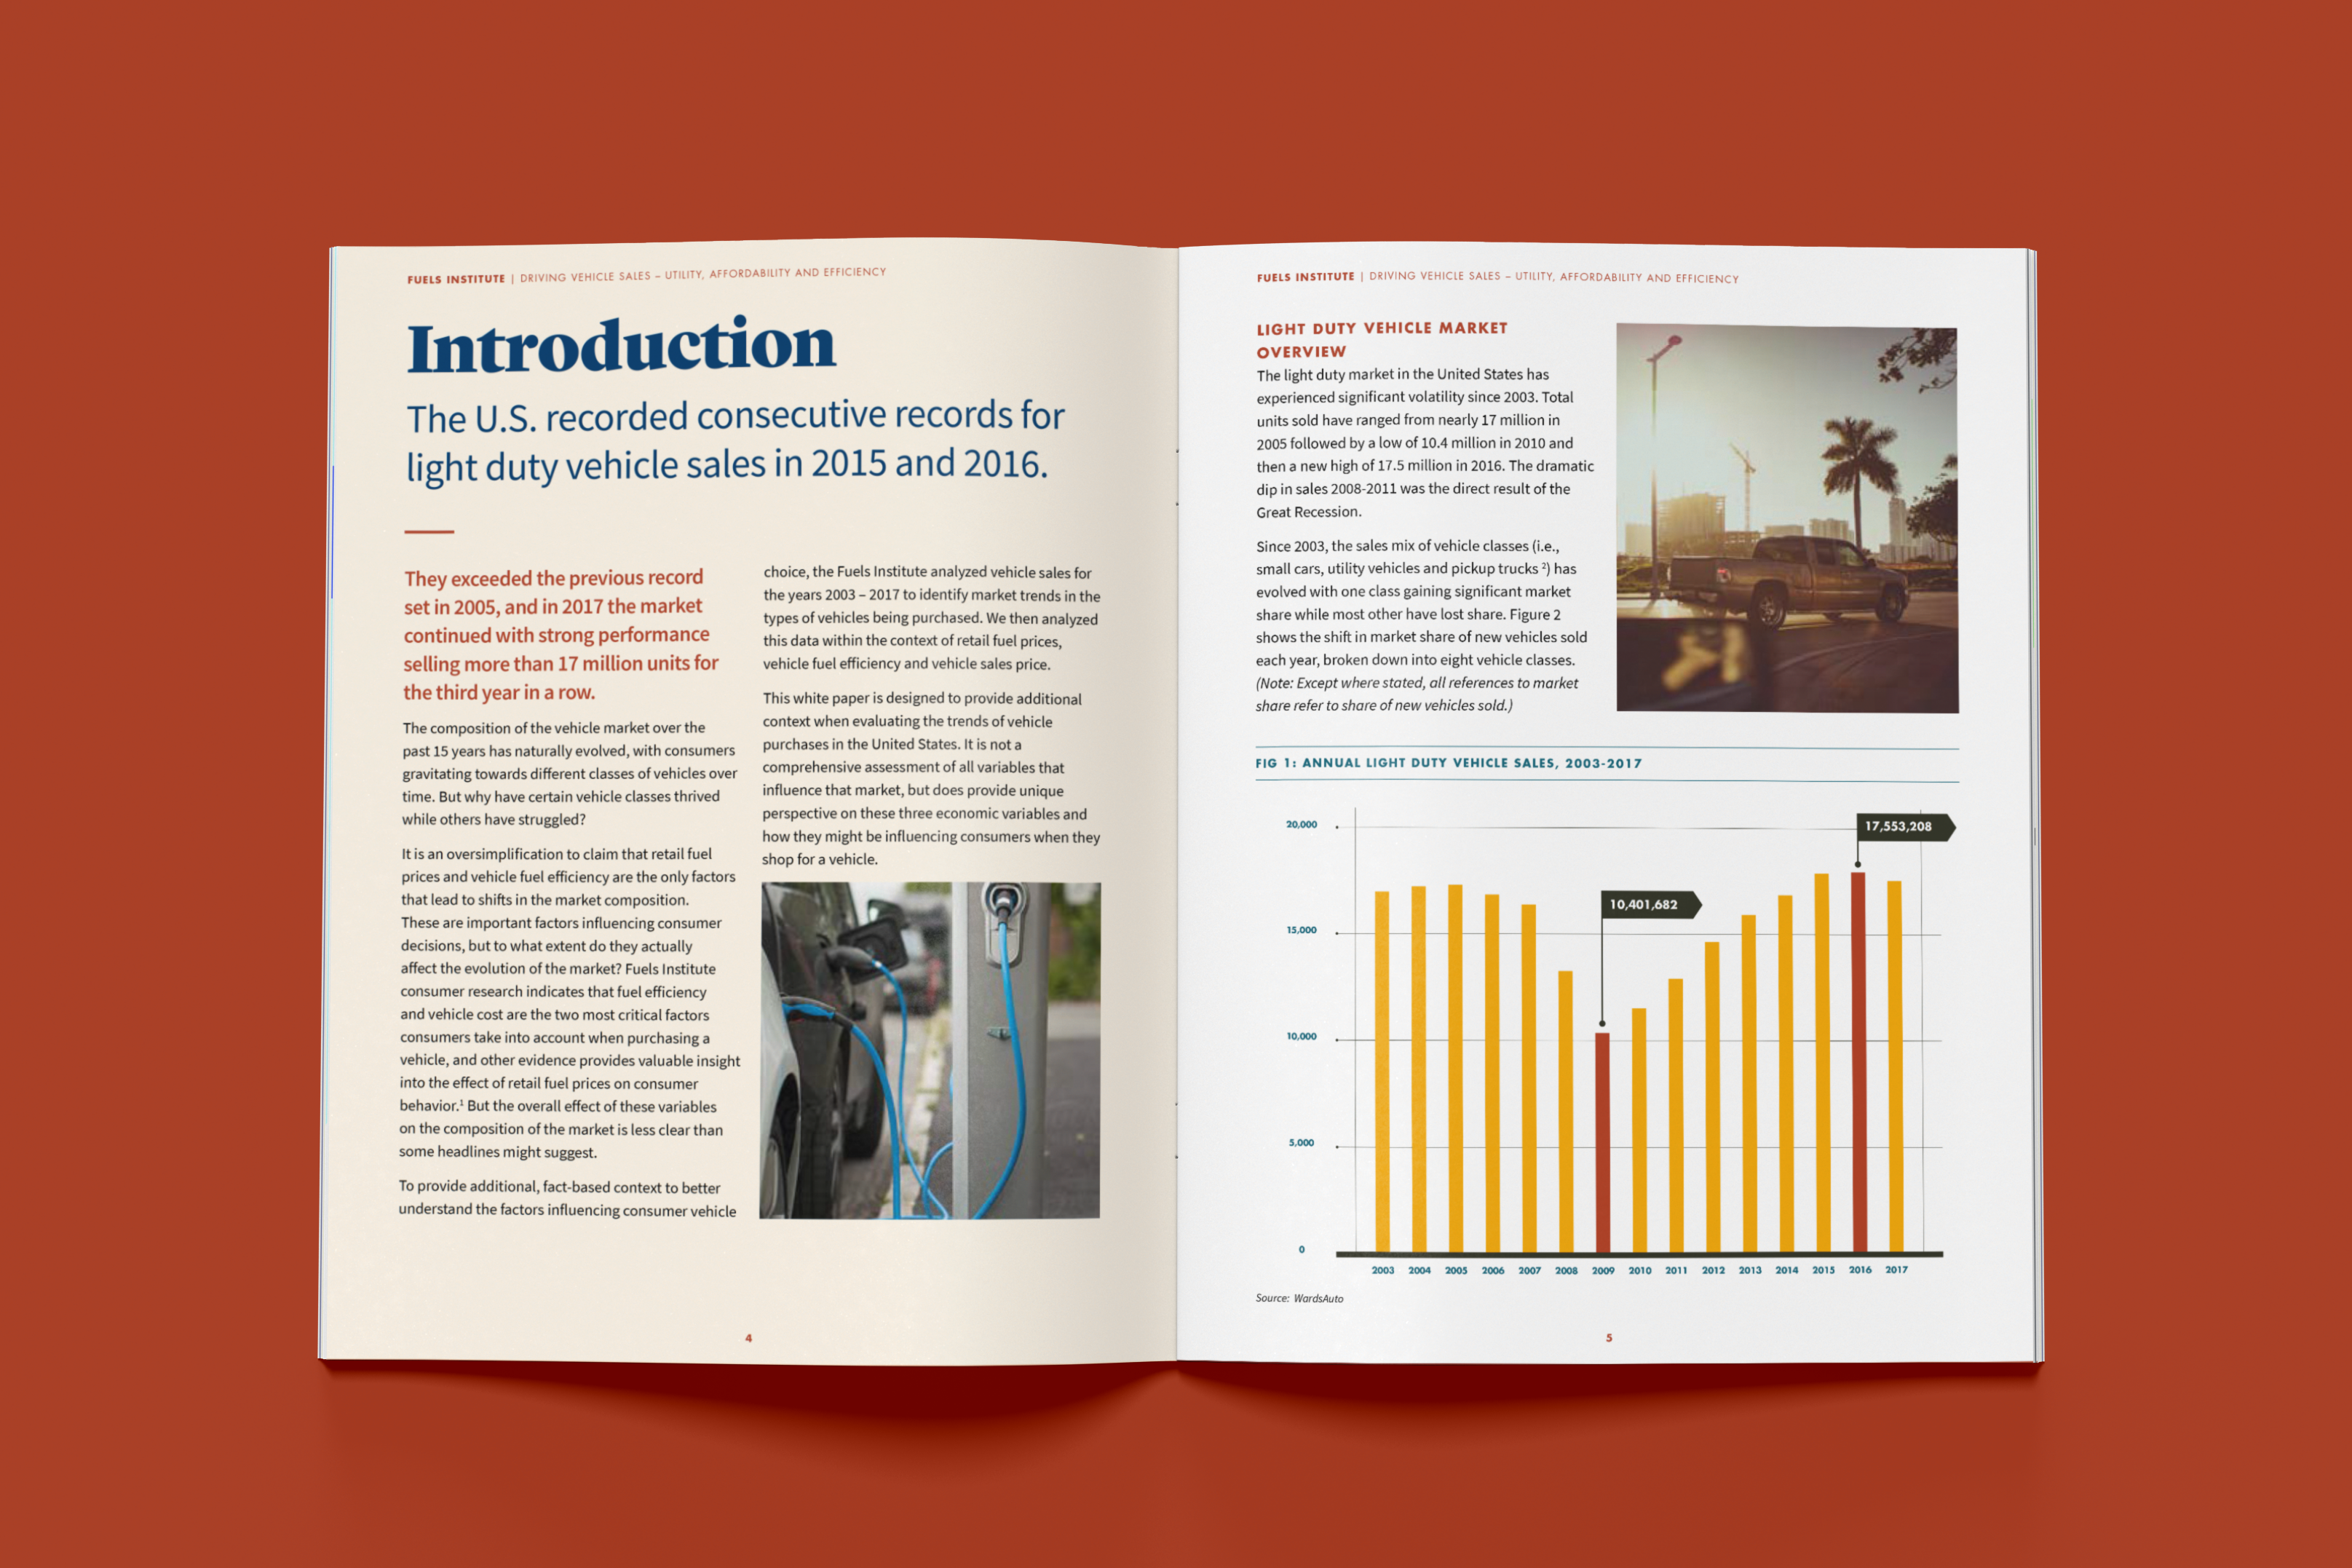
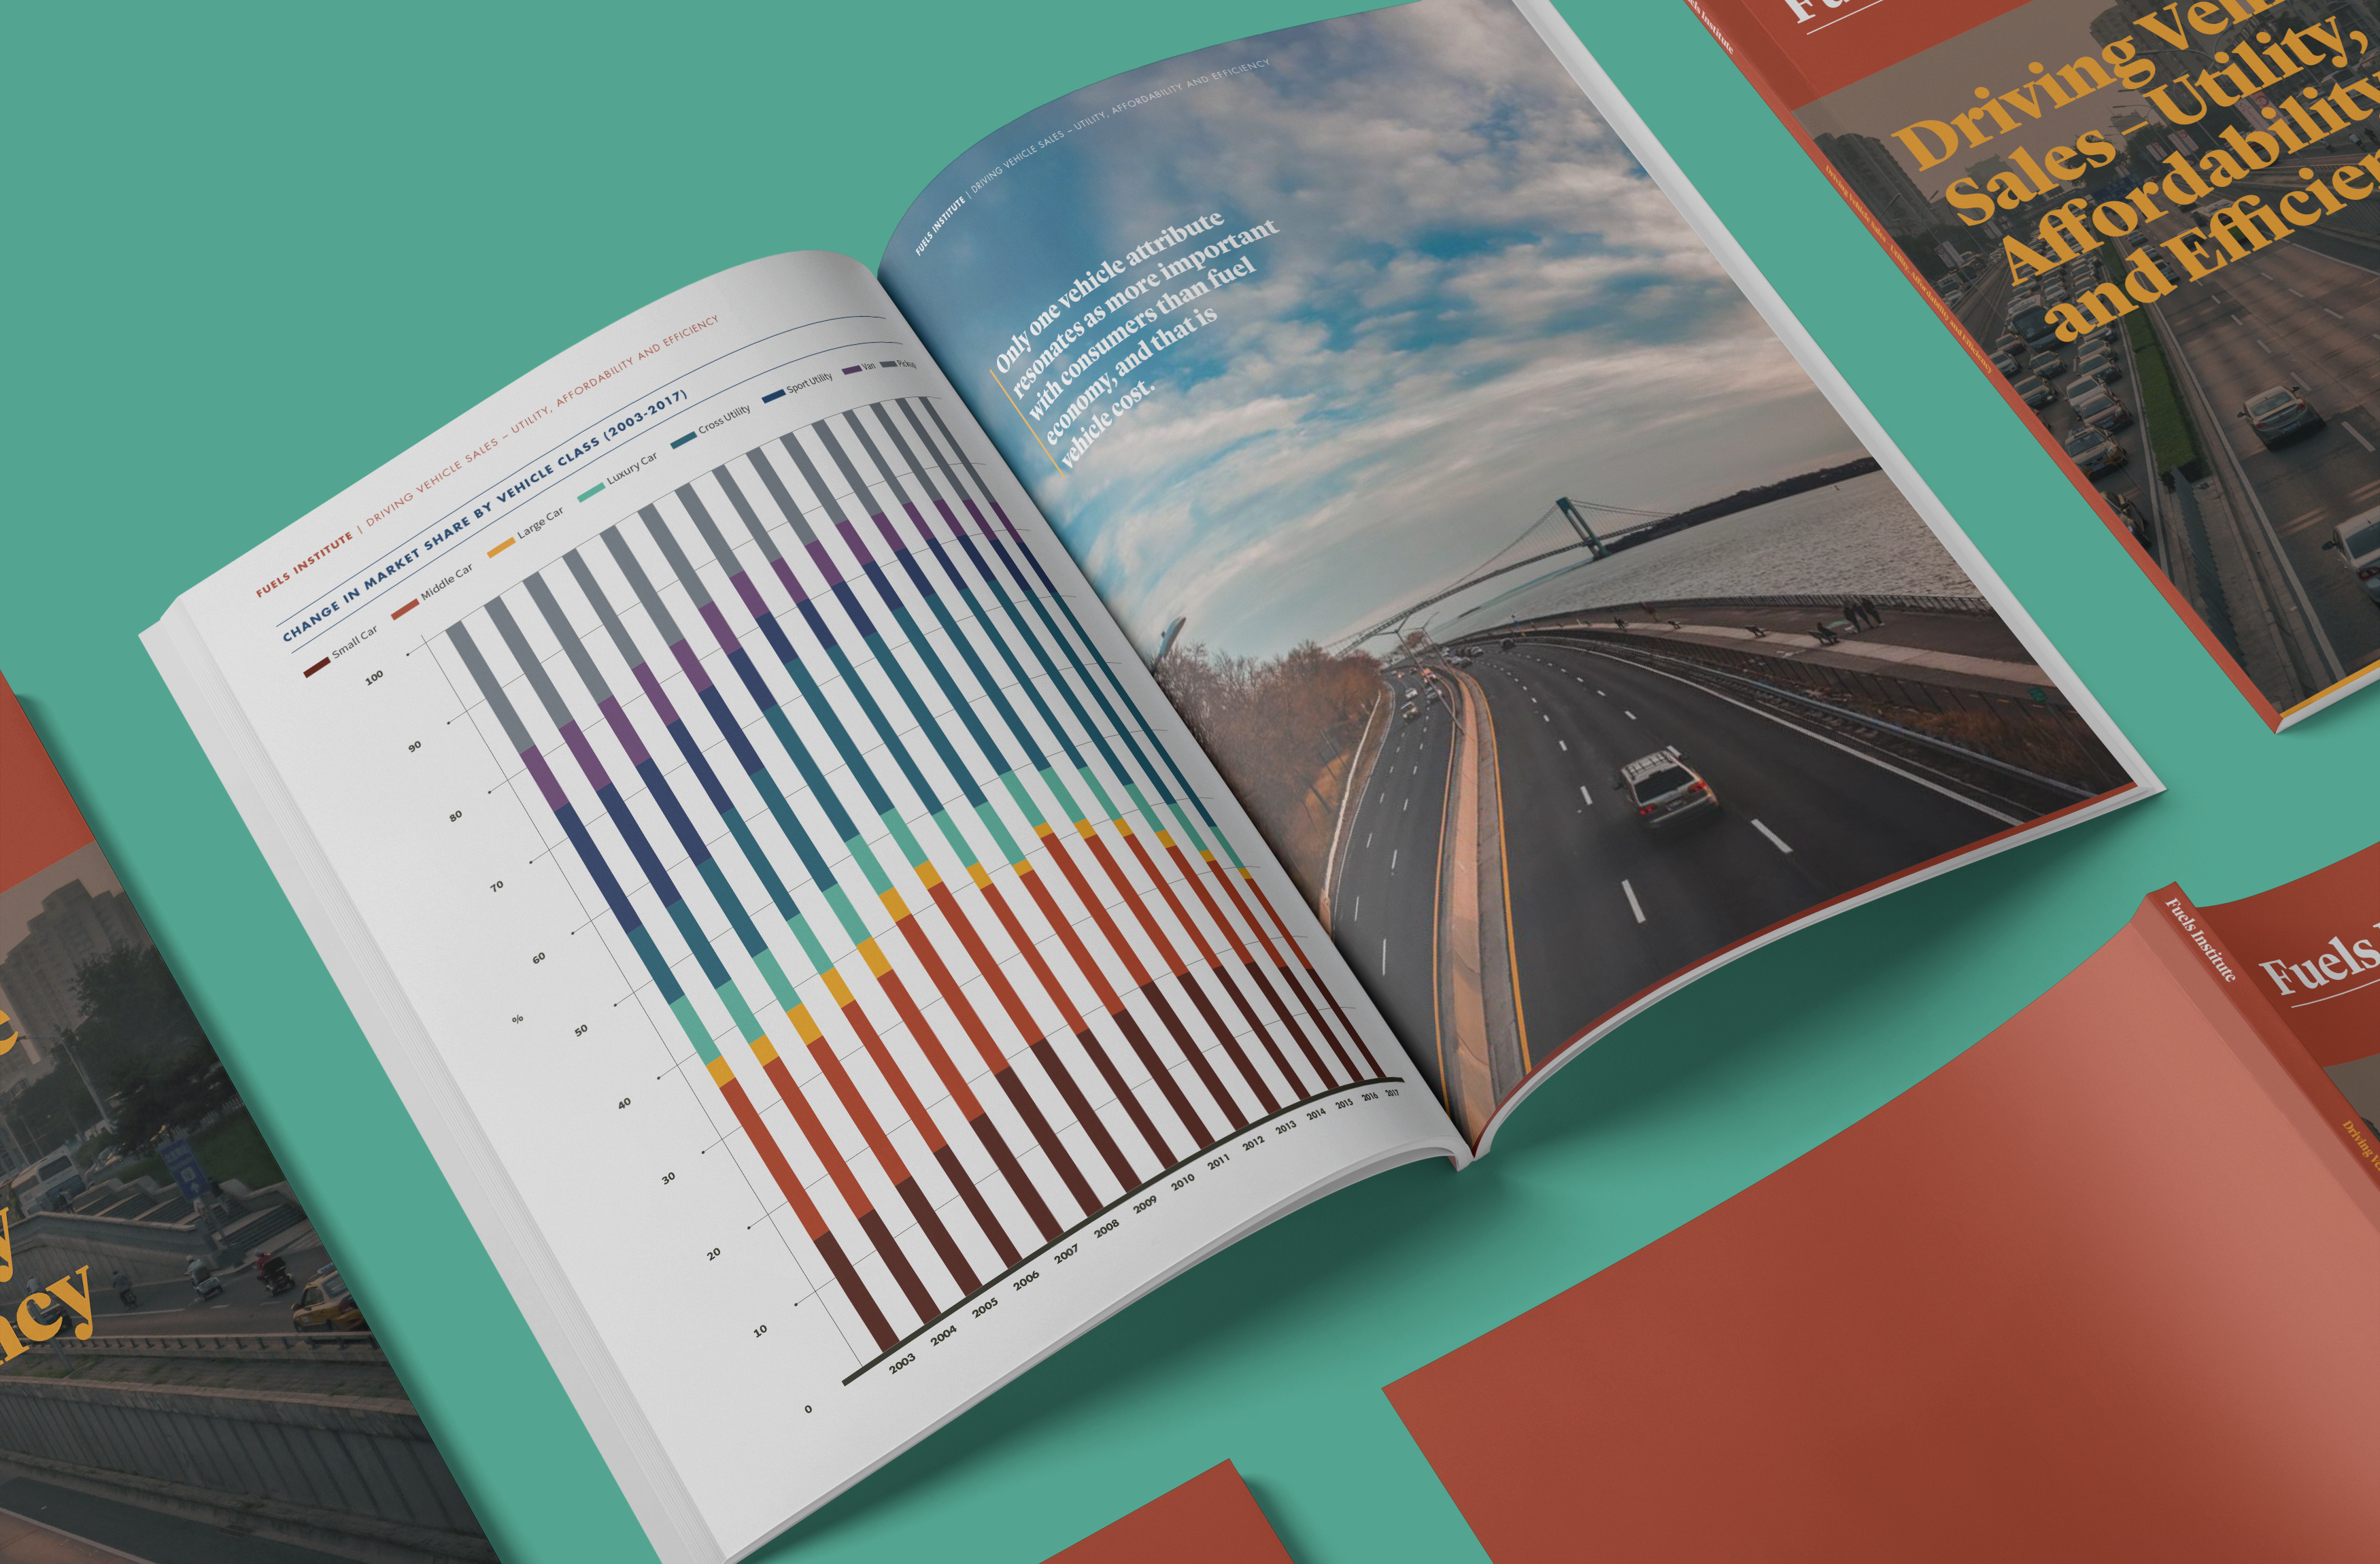
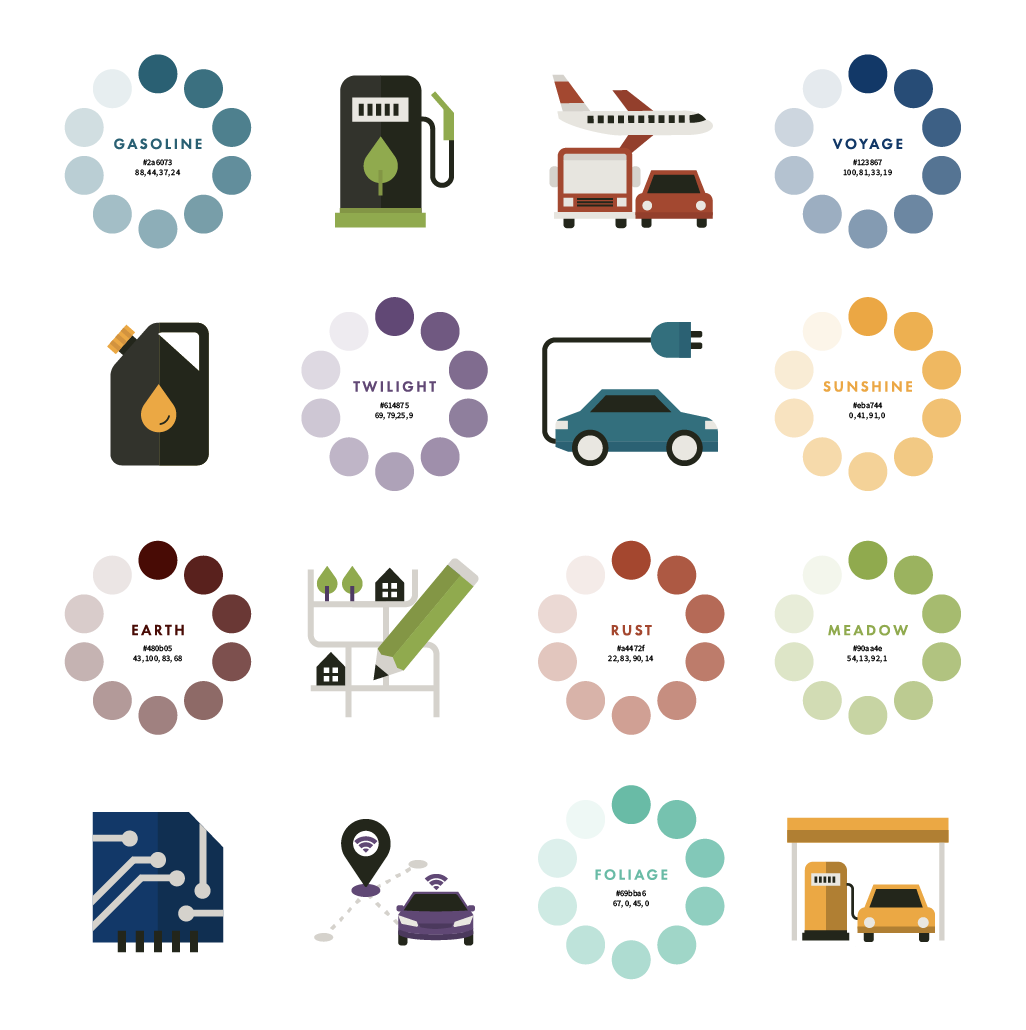
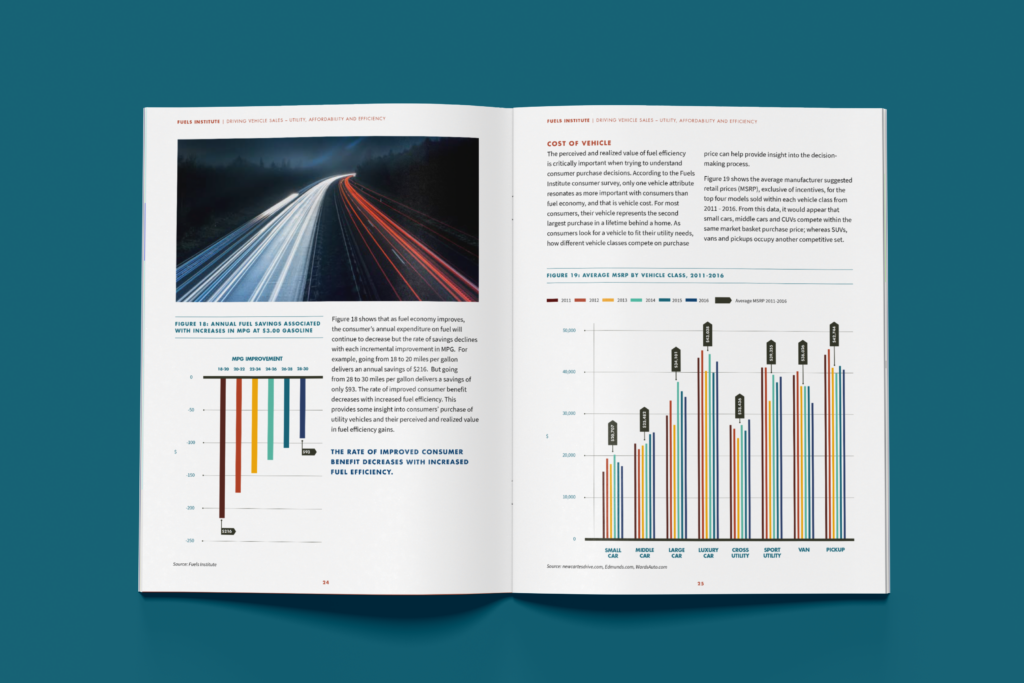

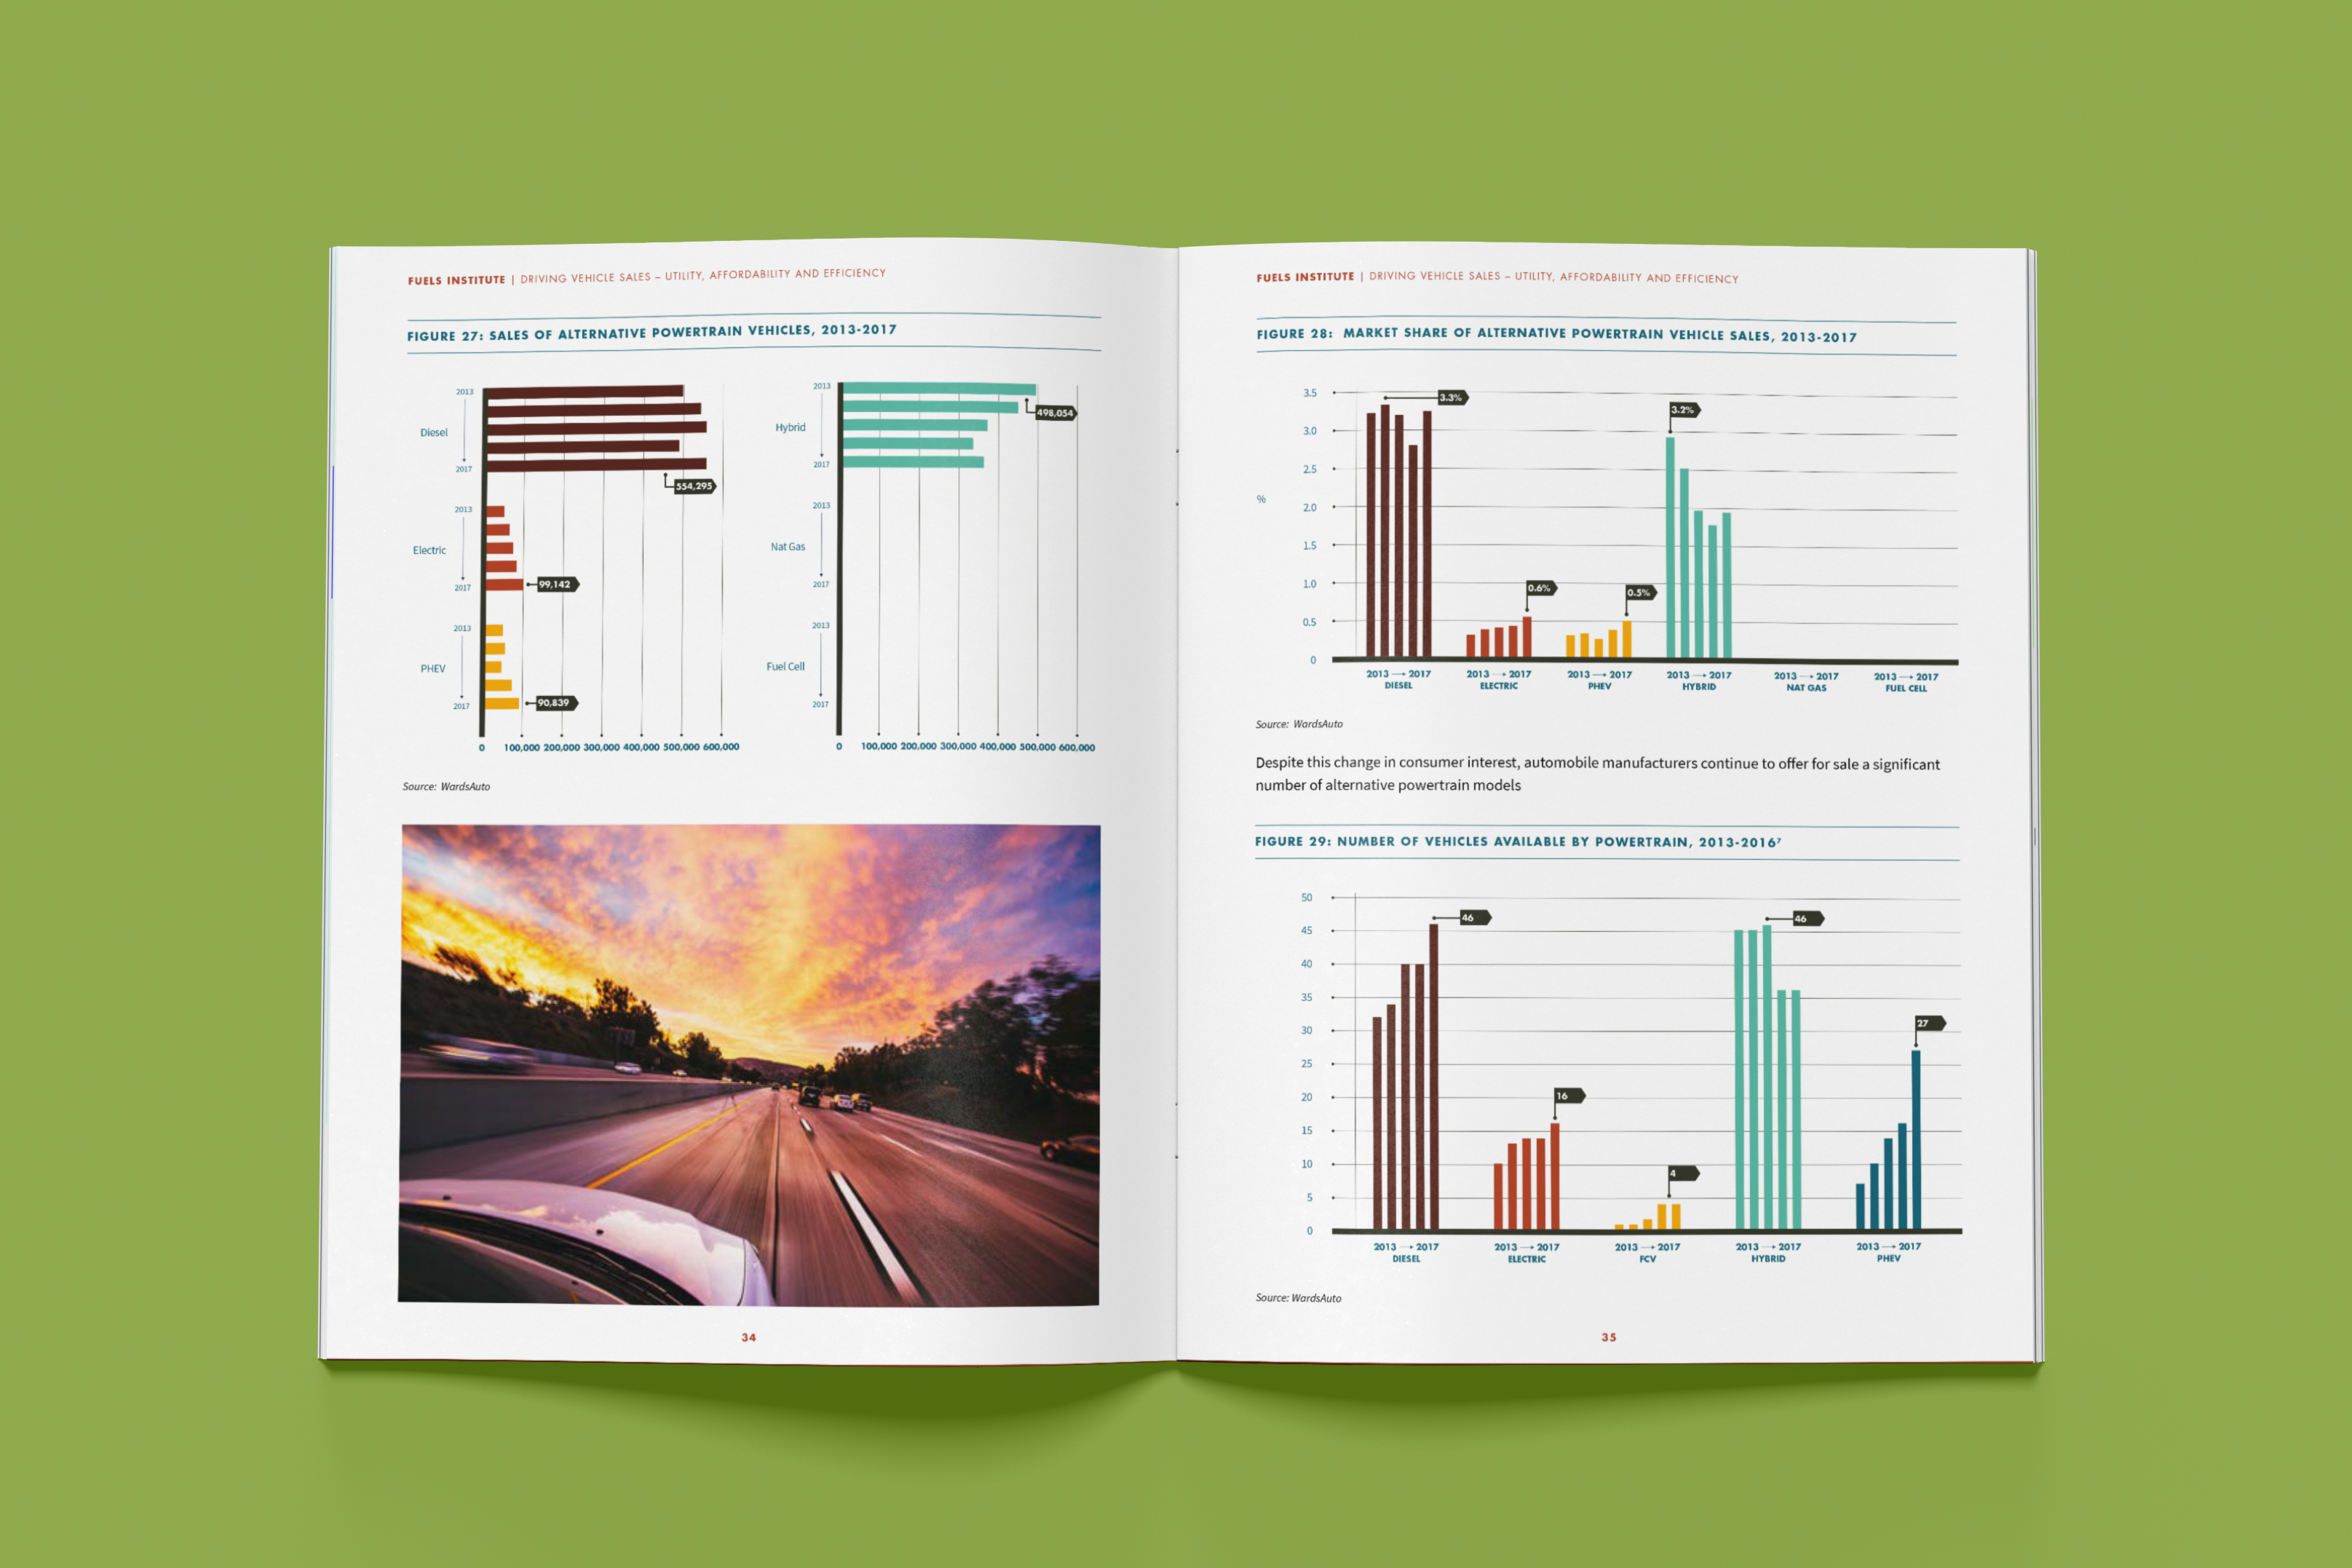
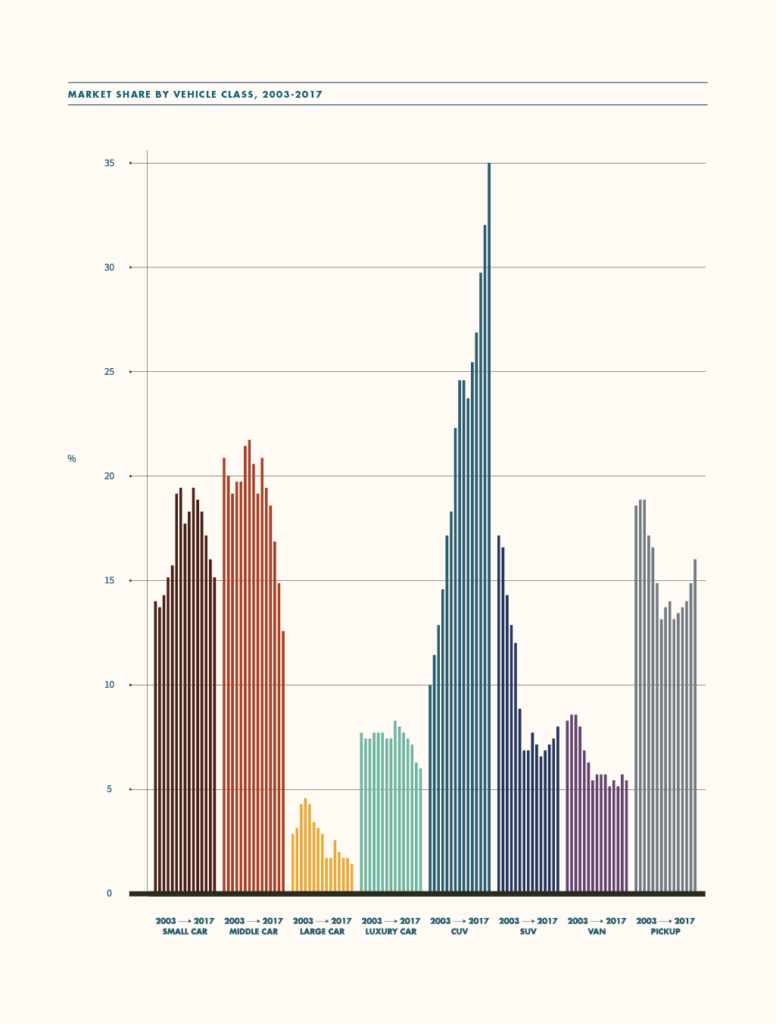

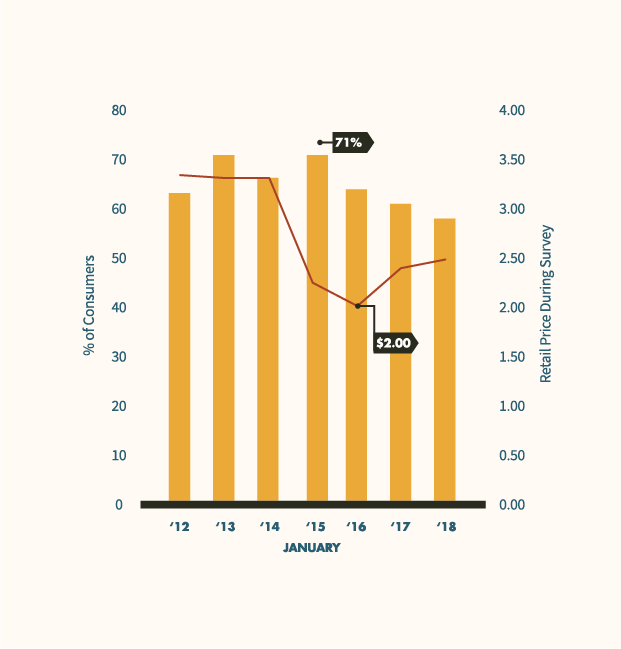

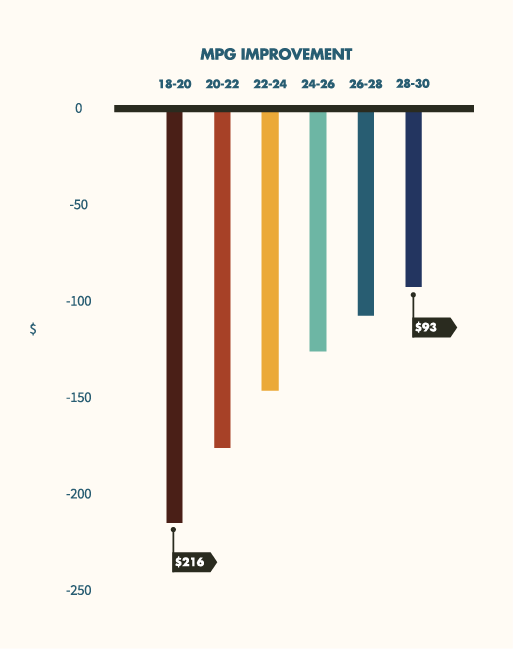

We worked with the Fuels Institute to design a report based on their analysis of vehicle sales from 2003 to 2017. Exploring how fuel prices, vehicle efficiency, and costs influence consumer choices, the report offers clear insights into how these factors have shaped trends in the evolving US vehicle market over the past 15 years.