BFI
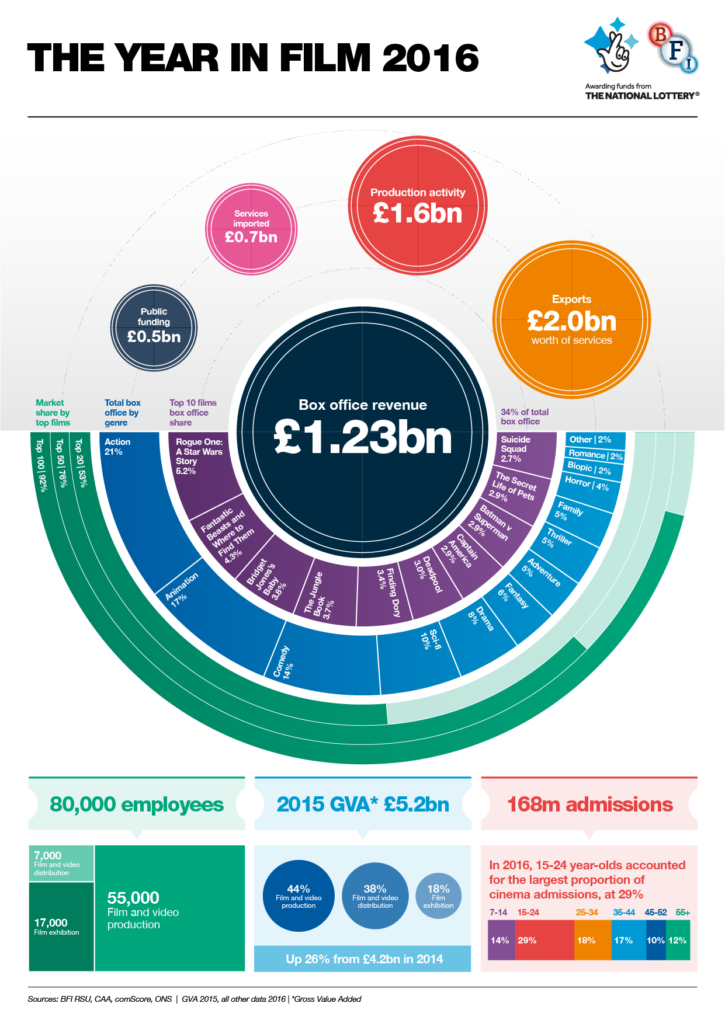
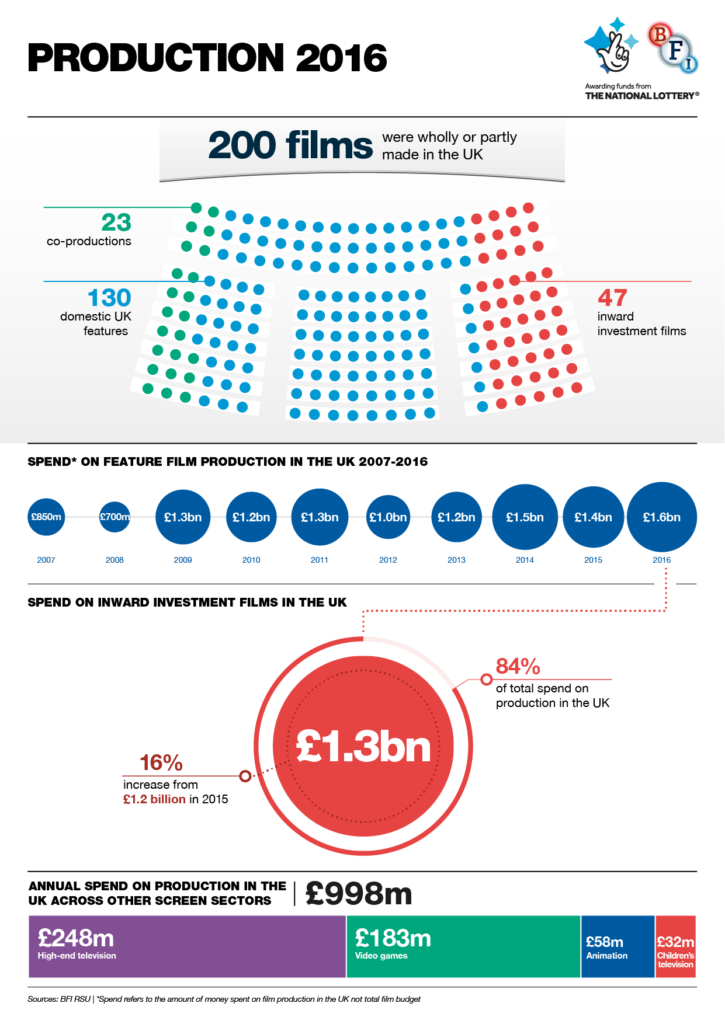
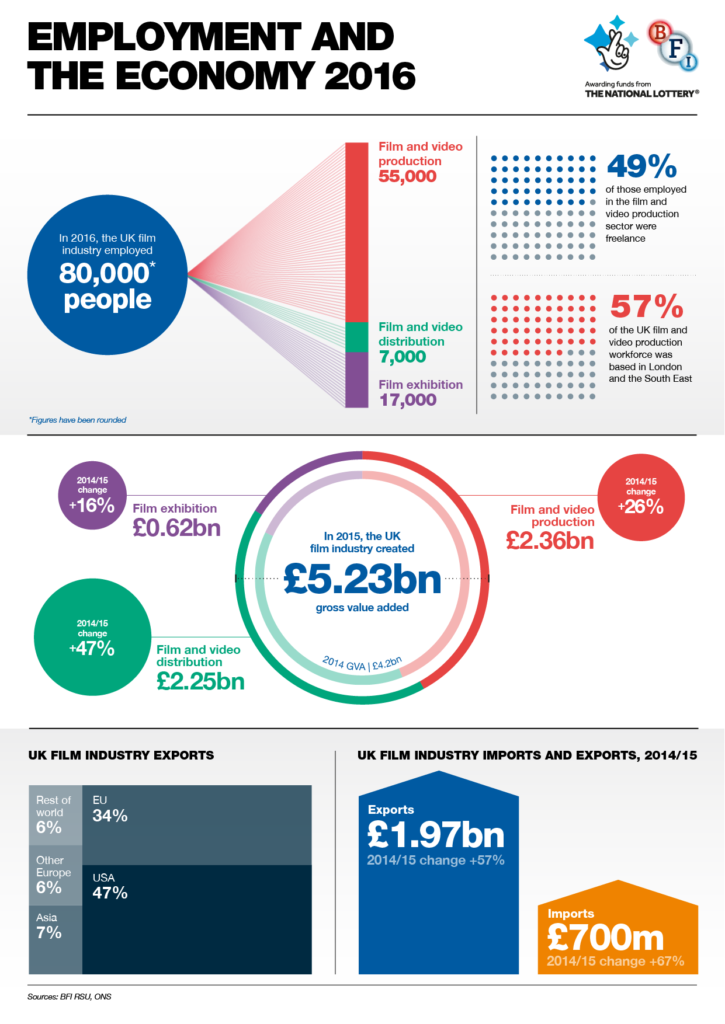
The BFI commissioned a set of infographics to present statistical data of their year in film for 2017, reporting on economic data from 2016. The challenge was to find a clear, concise way of presenting a lot of complex data in a visually appealing way. We produced an overview graphic, then split the data into clear cut sections with a visual output for each: Box Office, Production, and Employment and the Economy.